


Professor Carl Moody and Dr. John Lott have written up some comments on the latest Donohue et al. paper on concealed carry. For some perspective, you can see the academic literature on the issue here and the Amicus brief that we filed with a literature survey here.
Overall, Donohue uses dramatically different specifications and control variables across his multiple papers on right-to-carry laws, which speak of someone running as many specifications as possible to get the desired results. The problem is that measuring the impact of the right-to-carry law with a simple dummy variable not only ignores that more permits are issued over time and thus there is a greater deterrence effect, but this paper ignores how different the various state right-to-carry laws are from each other.
First the comments by Professor Moody and then after that the comments from Lott.
Response by Professor Carl Moody to Donohue, Cai, Bondy, and Cook, 2022, More guns, more unintended consequences
1. Internal consistency
The authors (hereafter DCBC) find that there is a 29 percent increase in violent firearm crime and a 12 percent increase in overall (firearm and non-firearm) violent crime associated with right-to-carry laws; the latter is not significantly different from zero. In fact, DCBC also find that there is no significant increase in murder, robbery, or assault associated with adopting right-to-carry laws. (DCBC, Table 2, p.14). The question arises, are these results internally consistent? Suppose the 29 percent increase is accurate. According to DCBC Table 1 (p.11), the total violent crime rate is 11.28. The firearm violent crime rate is 3.81, approximately 34 percent of the overall rate. This implies that the non-firearm violent crime rate is 7.47. A 29 percent increase in firearm violent crime will raise it to 4.23. If the non-firearm violent crime rate is unaffected by the passage of a RTC law, the total violent crime rate will increase to 11.70, a relatively small increase of 3.7 percent (not 12 percent). A 12 percent increase in violent crime means that 11.28 increases to 12.66. If firearm violent crime increases to 4.23, then non-firearm violent crime must increase to 8.43. (12.66-4.23=8.43) Thus, the only way to get a 12 percent increase in violent crime overall is for non-firearm crime to increase by 13 percent, almost half the increase in firearm violent crime.
Why would the passage of a RTC law cause non-firearm violent crime to increase? DCBC find that non-firearm violent crime, murder, assault, and robbery are not significantly associated with the passage of a RTC law. According to DCBC, “An unintended consequence of the enhanced potential danger from permitholders, however, may be that criminals arm themselves in response to this increased perceived threat, elevating the proportion of crime committed with a firearm.” (pp.7-8). But this implies substitution on the part of the otherwise unarmed criminals to become armed, causing firearm crime to increase, not non-firearm crime.
If the results for overall violent crime are increasing, but there is no statistically significant effect for murder, robbery, or assault, then the results have to be driven rapes. But virtually no rapes involve firearms.
2. A strange data set
DCBC use a sample of 47 US cities with populations over 400,000 for the years 1979-2019. According to DCBC, they chose this rather unusual sample because these cities are where “… violent crime is most concentrated.” (p. 4) Yet a look at the crime data for 2019 shows that 16 out of the top 47 cities in violent crime have populations under 400,000. The situation is worse for murder, the most serious crime. Of the top 47 cities in murder, 21 have populations under 400,000. In fact, the top city in both murder and violent crime rates in 2019 is St Louis, with a population of 310, 284. So, violent crime is not concentrated in cities over 400,000. If we look at the top 100 in terms of the crime rate, the majority (53) are cities less than 400,000. Another question is, why choose the 47 cities with 400,000 and even then drop some of them? Why not cities with a population over 500,000? Or 100,000? Or 10,000? Why not pick cities with the most violent crime? It seems an odd choice.
Those 47 cities account for only 32 percent of violent crime.
Also, why did DCBC use population from 2019? If your sample is from 1979-2019, you should use population values from a census in the middle of the period (i.e., 2000). Instead, they used a 9-year-old census to create an estimate at the very end of the sample period. This could be important because some cities lost population over the sample period while others gained. Ideally, you would use a larger number of cities based on the 2000 census.
DCBC address their choice of using a tiny sample in a footnote, “While there are benefits to using more agencies… there are also potential costs.” (fn. 15, p.9) They then cite two unpublished papers claiming that the FBI underreports crime data. And the FBI data “…appears to have even greater reporting flaws for agencies serving smaller populations.” Apparently, these authors do not believe that more information is better than less. But their caution is unnecessary. The coefficient on the right-to-carry dummy variable is the average difference between the crime rate before and after the passage of the right-to-carry law in each city. Even if the underreporting in the smaller cities is greater than that in the larger cities, it is presumably the same before and after the policy change for the small cities, so the difference is unaffected.
Also, DCBC seem to engage in excessive “data cleaning.” For example, they removed “…crime observations that were sharp discontinuities from the proceeding and following year.” (p. 10) How do DCBC distinguish between recording errors and draws from the tails of the data generating process? They also “… removed all observations for a particular city-crime if the city-crime was missing more than 15 observations ….” (p.10) So, if a city had 15 missing observations, they dropped the remaining 26 observations. That is unnecessarily restrictive. The statistical model does not require all cities have a complete set of observations. Why throw out all that information? Why not at least mention if throwing out all that information impacts the results?
3. Modeling and control variables
DCBC also have an odd set of control variables. The choice of control variables is critical in determining the results of a regression analysis. Omitting a relevant variable will cause the resulting estimated coefficient on the RTC dummy to be biased. DCBC outsourced the modeling problem. “Our choice of control variables makes only one addition to the nine socioeconomic and demographic controls used in Kovandzic, Marvell, and Vieraitis (2005) (hereinafter “KMV”) …. The KMV nine controls are the percentage of the population made up of female headed households, the percentage of people living alone, per capita income, percentage of people in poverty, and four demographic controls….” (P. 10.) Yet, in a paper that DCBC cite many times, Donohue, Aneja, and Weber (2019), Donohue’s “preferred” set of control variables include two variables that he omits in this paper, the unemployment rate and the percent of the population living in urban areas (a measure of density), potentially omitted variables. The unemployment rate is typically included in every crime equation.
Interestingly, despite Donohue in a series of papers and talks demanding that any estimates include crack cocaine, DCBC do not include a variable to account for it (Ayres and Donohue, 2003 and Donohue, 2008). For example, in one talk on National Public Radio, Donohue claimed: “The elephant in the room was crack cocaine. The states that did not pass the right-to- carry laws were states that had a big problem with crack-cocaine which had an enormous influence in running up crime.”
Also, KMV include a lagged dependent variable to capture dynamic effects and individual city trends. DCBC include neither. The city trends are normally included in crime models to capture factors that affect crime, such as advances in DNA analysis, advances in critical care that turn potential homicides into assaults, the growing number of smartphones with cameras, ubiquitous security cameras, etc., that are otherwise omitted from the model. These trends could be different from city to city, requiring that each city have its own. The omission of the lagged dependent variable could be even more important because, if its coefficient is positive, as is very likely in crime models, its omission produces positive autocorrelation, which in turn causes the model to underestimate the standard error and overestimate the apparent significance of the results. DCBC do not report any tests for autocorrelation.
KMV measure the impact of the RTC law with a post-law trend. DCBC use a single dummy variable. If the effect of a RTC law increases with the number of people with permits to carry, as might be expected, the trend will do a better job of measuring the effect of the law. Also, there is evidence that late-adopting states put obstacles in the way of people seeking concealed carry permits, so that the effect could vary across states, possibly biasing the coefficient on the RTC dummy.
Unlike KMV, DCBC use a sample of 142 fewer cities. KMV limited themselves to cities with populations over 100,000 people. Strangely, while DCBC cite Lott’s second edition of More Guns, Less Crime, both Lott’s second and third editions examined city level data for all cities with at least 10,000 people (2010, 191-194), but DCBC seem unaware of this.
4. Replication using state data
DCBC refer to several online appendices. However, I have been unable to find them. So, in an attempt to replicate their findings, I use my state-level data set, on the theory that if RTC laws cause a significant increase in violent crime among the largest cities in the various states they would cause the corresponding state-level crime to rise. My experience is that if you don’t break down the RTC dummy variable into early and late adoption variables, the coefficient on the simple RTC dummy tends to be small and insignificantly different from zero. Nevertheless, I assembled a set of control variables like those used by DCBC, including income, poverty, beer consumption, two demographic variables, and population density. I also include the unemployment rate and a lagged dependent variable, the latter of which is highly significant. Table 1 shows the results.
Table 1: State-level replication of DCBC
Notes: The coefficient on the RTC dummy is small (one-third of one percent) and insignificantly different from zero. The static version of the model, not reported, has highly significant autocorrelation (ρ=0.913, p-value=0.000). If the same is true for the DCBC static model, their standard errors are seriously underestimated, leading to a potentially spurious regression.
This replication exercise also raises questions for the DCBC analysis of the effects of RTC laws on clearance rates. They speculate, “One reason that clearance rates might fall in the wake of RTC adoption is that the crime increases resulting from the new regime burdens the police, thereby impairing their ability to clear crimes at the same rate.” (P.14) So, more crime causes clearance rates to fall, causing more crime. This is obviously a dynamic relationship and should be modeled as such. The simplest approach is to add a lagged dependent variable. If DCBC had done this for all of their models, I suspect that their results would have been very different.
References
- Ayres, Ian, and John Donohue. “Shooting Down the ‘More Guns, Less Crime’ Hypothesis.” Stanford Law Review 55, no. 4 (2003): 1202–1309.
- Donohue, John J, Abhay Aneja, and Kyle D Weber. 2019. Right-to-Carry Laws and Violent Crime: A Comprehensive Assessment Using Panel Data and a State-Level Synthetic Control Analysis. Journal of Empirical Legal Studies, 16(2): 198-247.
- John Donohue, “Do Guns Reduce Crime?” debate on National Public Radio, November 5, 2008 (broadcast available at http://www.npr.org/templates/story/story.php?storyId=96409853).
- Kovandzic, Tomislav V, Thomas B Marvell, and Lynne M Vieraitis. 2005. The Impact of ‘Shall-Issue’ Concealed Handgun Laws on Violent Crime Rates: Evidence from Panel Data for Large Urban Cities. Homicide Studies, 9(4): 292-323.
- Lott, John R., “More Guns, Less Crime,” University of Chicago Press, third edition (2010).
Response from Dr. John Lott
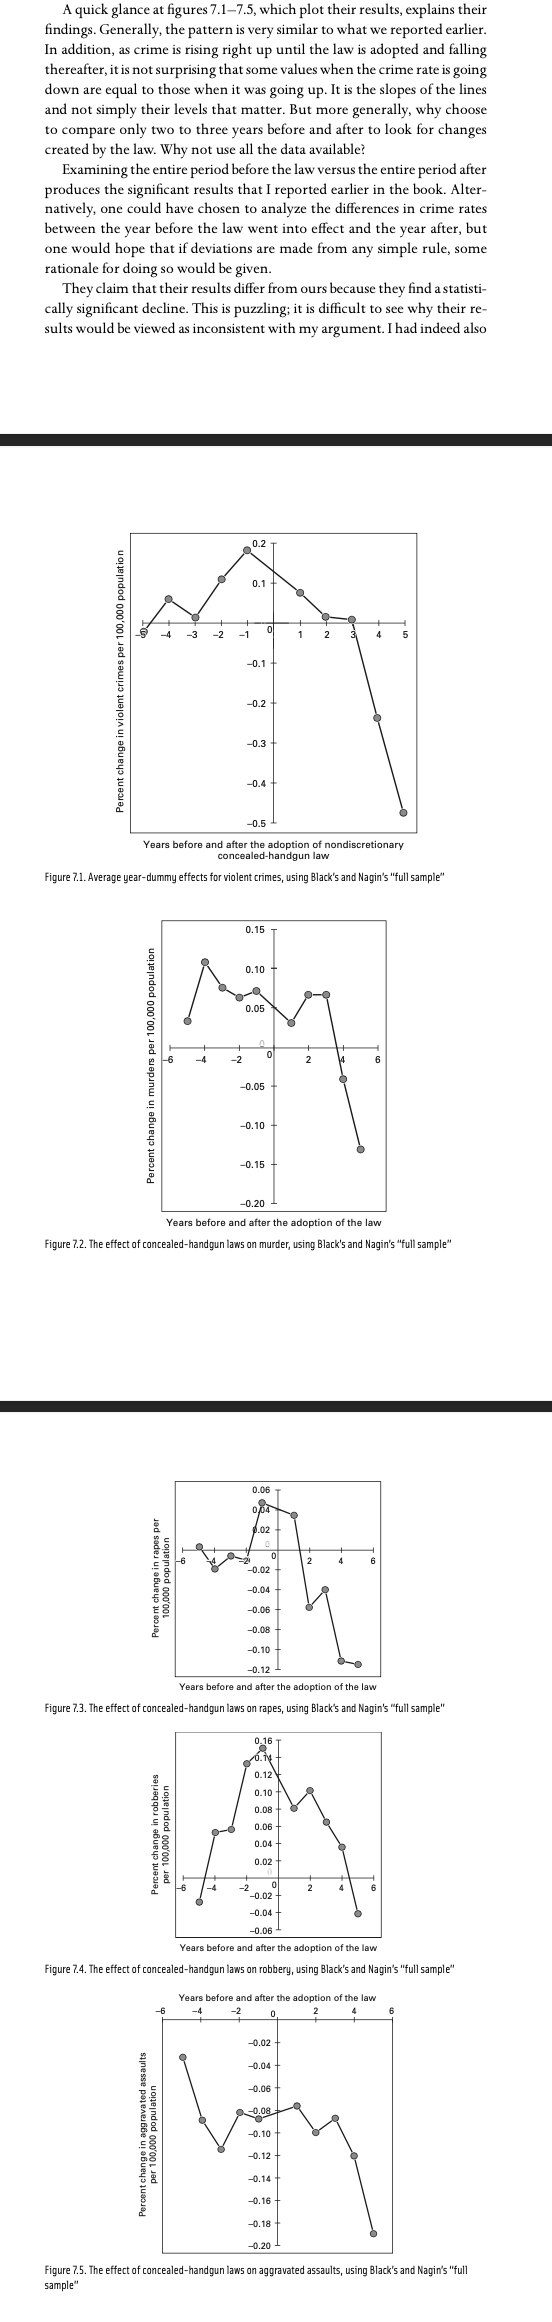
I don’t know how many times over the last couple of decades I have repeatedly pointed out in my research that you simply can’t assume that all right-to-carry laws are the same. There are huge differences in the percent of the adult population with permits and differences in who get permits (e.g., is it wealthy whites who live in the suburbs and don’t face much of a risk from crime or poor blacks who live in high crime urban areas who are at great risk from crime). Those differences arise from huge differences in the cost of getting permits. At the very least one has to take into account that the longer the permitting rules are in effect, the more permits tend to be issued. But looking at the simple before and after averages is often very misleading. Here is a discussion from the second edition of More Guns, Less Crime (2000) that Donohue, Cai, Bondy, and Cook cite but apparently have not read.
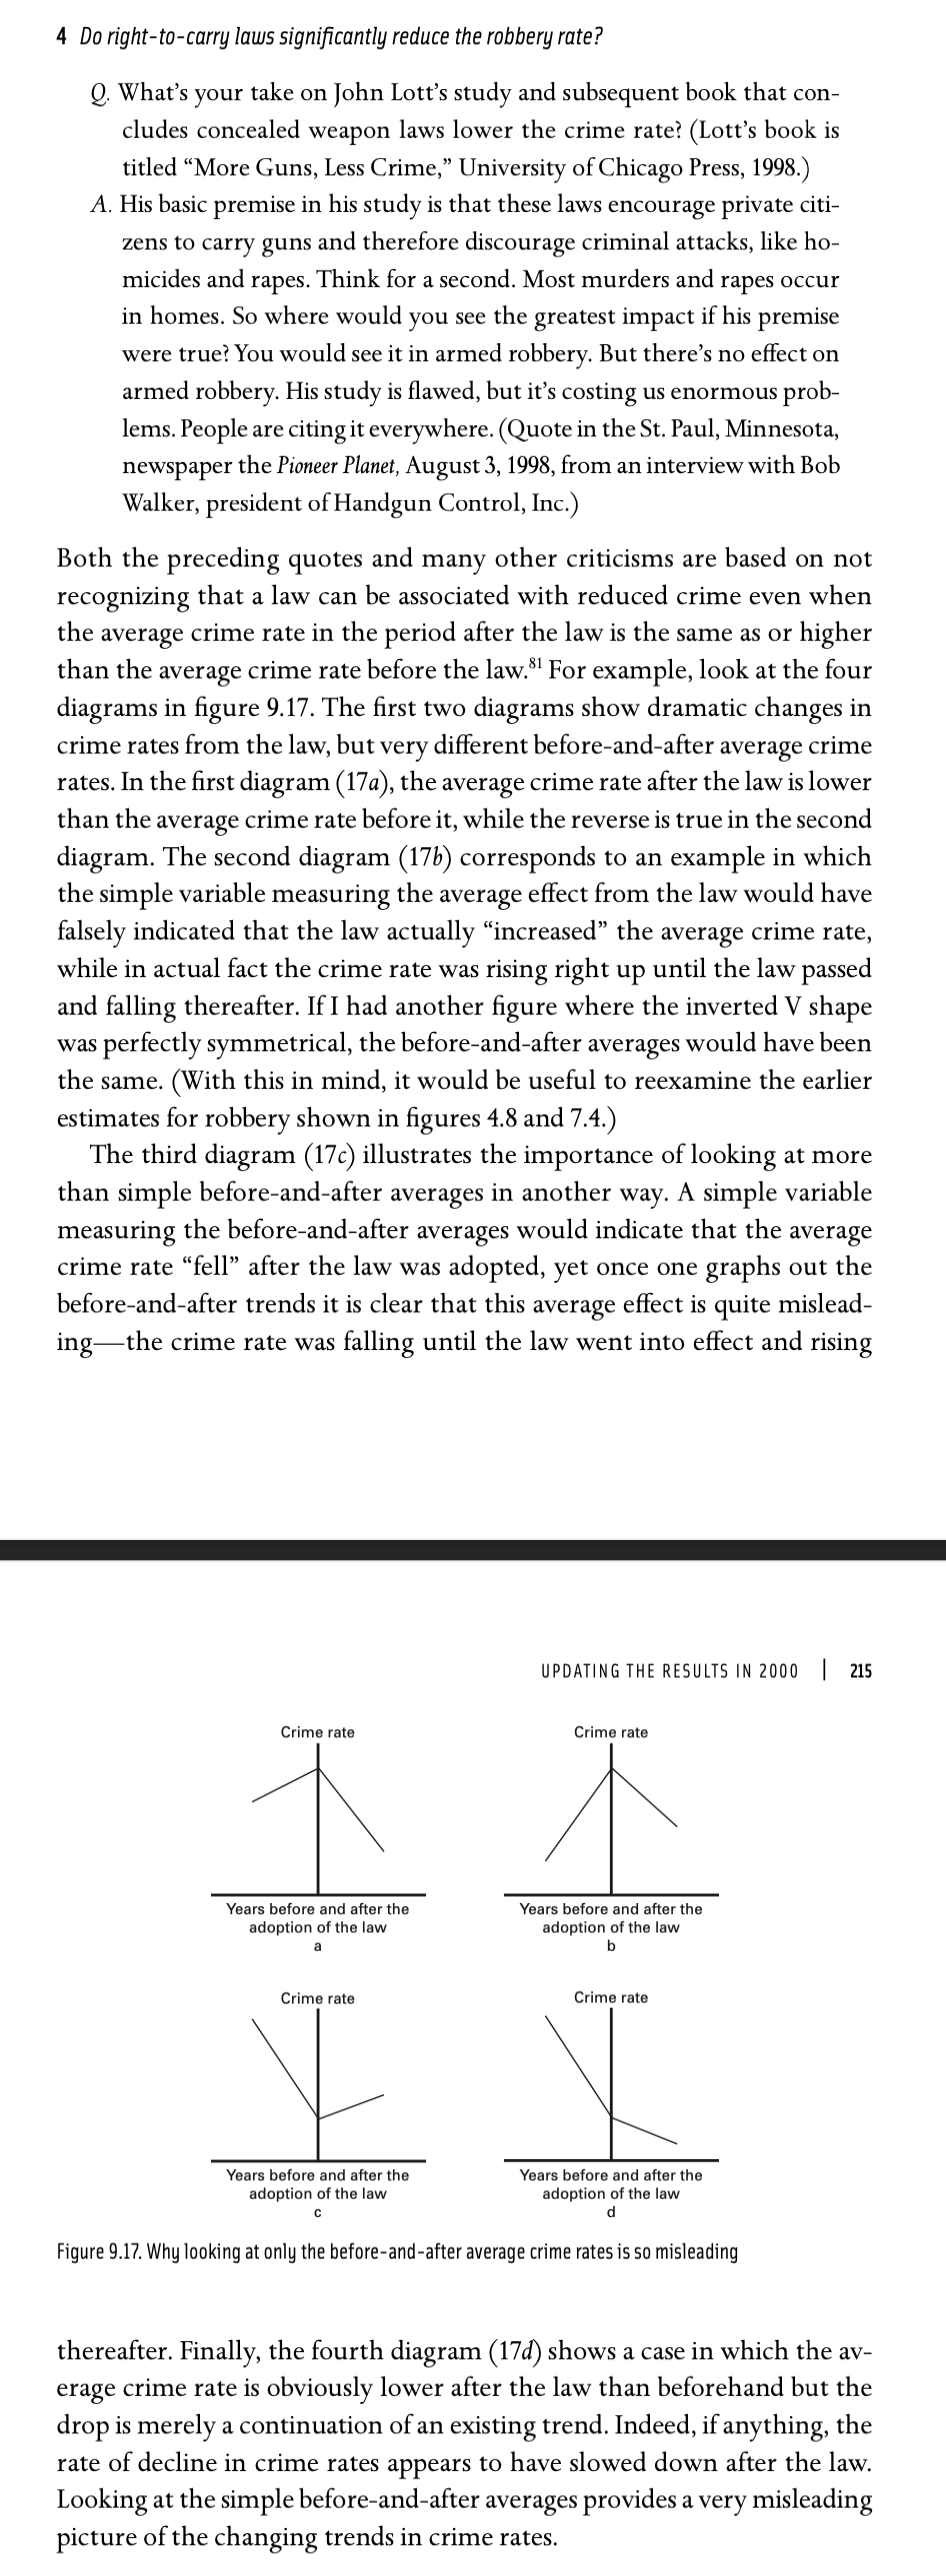
If you use a simple dummy variable to measure the impact of the law, you are implicitly assuming that the crime rate was flat at a certain level before the law and again flat at the same or different level afterward. Yet, Donohue’s own past work has confirmed this is not the pattern we observe so it is puzzling why he would now use a simple dummy variable without any discussion of why he did that. Donohue’s paper with Ian Ayres in the 2003 Stanford Law Review is one of many examples of him accounting for different before and after law trends.
Here is a similar discussion from the first edition of MGLC. At the very least, researchers can’t simply use a dummy variable to measure the impact of right-to-carry laws.
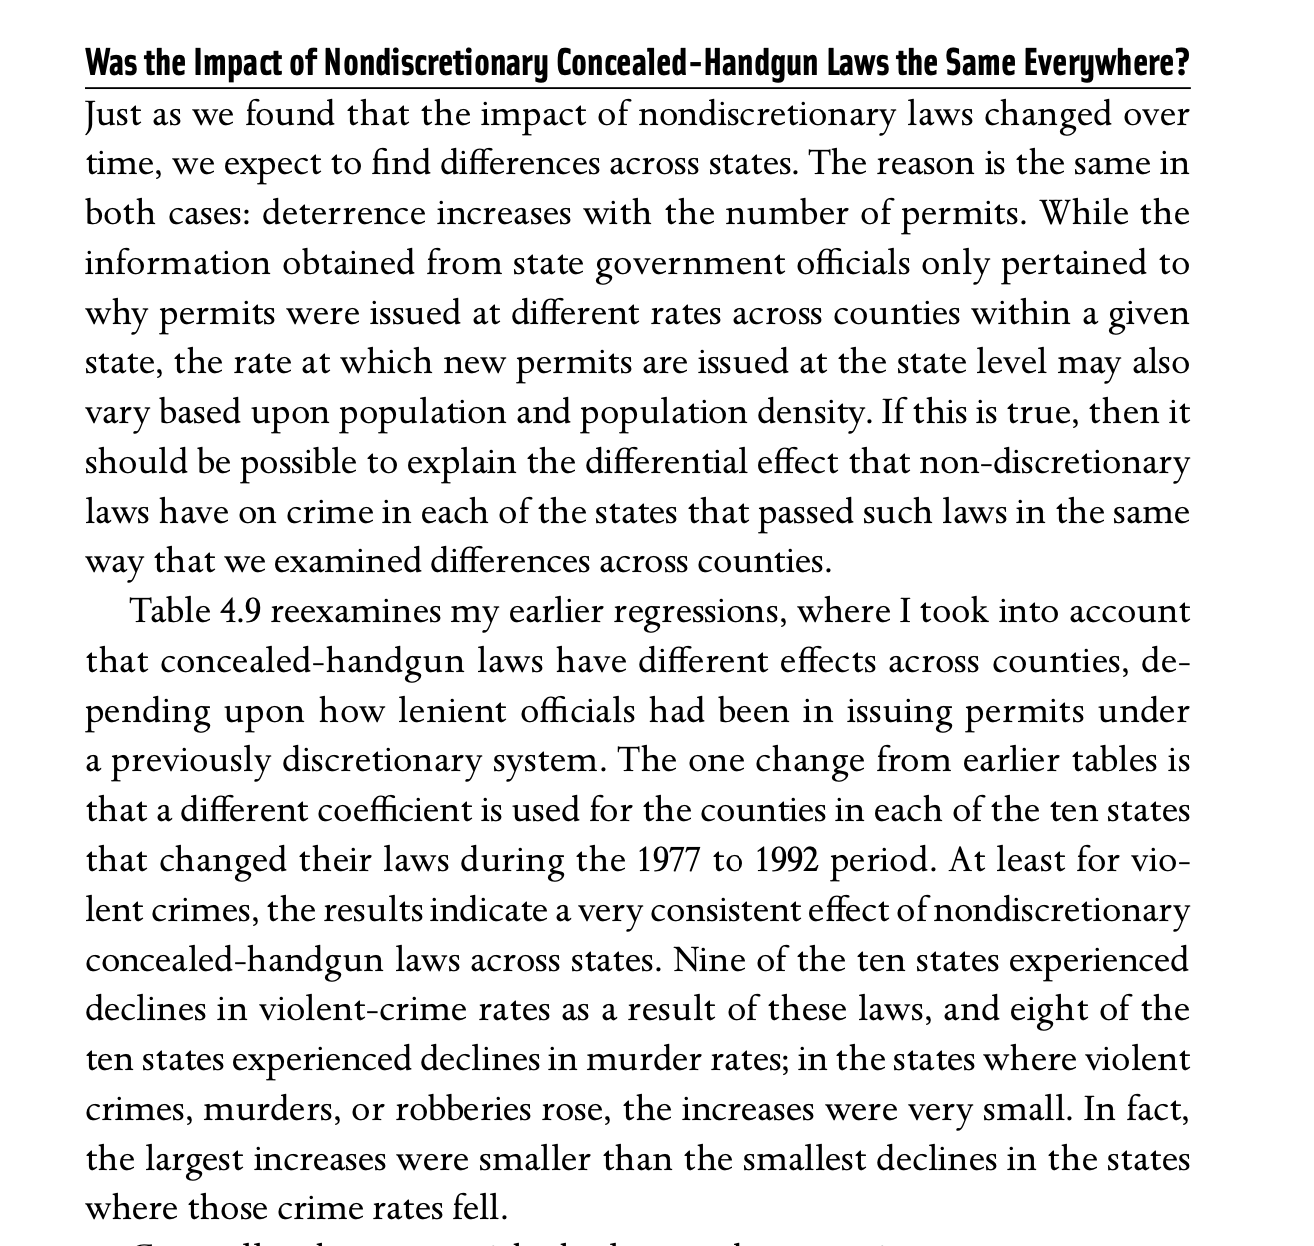
Here is the beginning of one of the sections in the first edition where I explicitly go through the differences across places. Much more of a discussion and attempts to properly address this issue in differences in permit fees, training requirements, places where guns were banned (gun-free zones), and how long the law had been in effect were accounted for in the second edition.
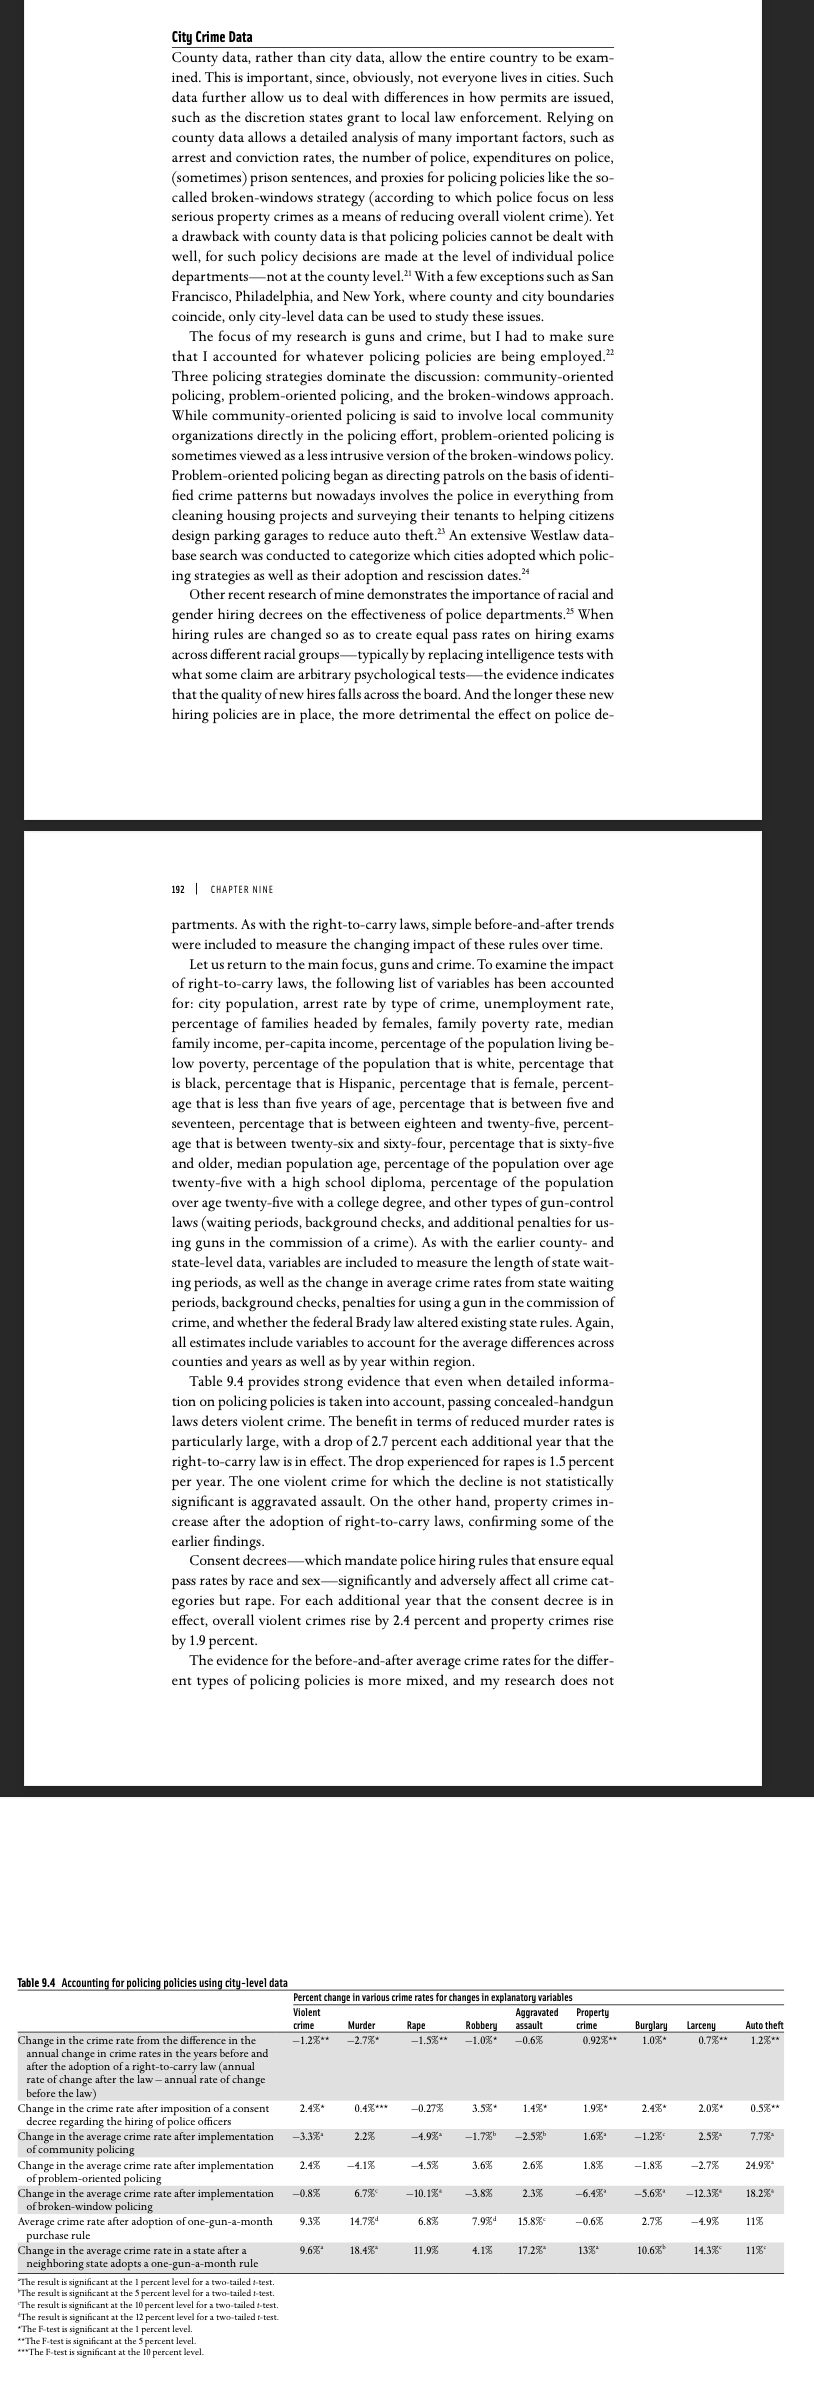
Finally, Donohue, Cai, Bondy, and Cook seem oblivious to the fact that I had already looked at city-level data in addition to examining county and state-level data. Here is a discussion from the Second edition of More Guns, Less Crime. The reader will note that even here I used before and after law trends.
This article originally appeared in the Crime Research Prevention Center. The opinions expressed in this article are those of the author and do not necessarily reflect the positions of American Liberty News. Republished with permission.
Dr. John R. Lott, Jr. founded the Crime Prevention Research Center (CPRC). An economist and a world-recognized expert on guns and crime, Lott served the Trump administration as the Senior Advisor for Research and Statistics at the Department of Justice's Office of Legal Policy.


Pew Research compared the crime rate of all known demographics. THE MOST law abiding demographic is conceal carry permit holders.
There is no correlation between the number of guns in the U.S. and the crimes committed with guns—NONE. For over 20 years the rate of crimes committed with guns has decreased, while the number of guns in the U.S. increased. In the last two years violent crime committed with guns increased. So, the correct question to answer is what changed in the last two years? And which change or changes are primarily responsible?
There are lots of candidates, but an increase in the number of guns is not one of them.
There are two things this article completely ignores:
1 – The very words of the second amendment – “SHALL NOT BE INFRINGED.” Every law requiring how to keep and bear and every law requiring permission from the government is an infringement.
2 – The requirement in the Constitution of the United States under Article VI, Claus 2 that ALL judges are held to the Constitution as the supreme law, no matter WHAT the state laws say. Look that up.
It’s not the lawful gun owner than the government has to worry about but, if they continue to violate our Constitutional rights in every way they possibly can, it might just become the angry lawful gun owner that they will have to deal with.
This is all very impressive but there are just a very few simple issues of which we dare not whisper which are the real tell-tale indicators for violent crime.
Neither the right nor the left will dare address these simple issues, because one side desperately needs what these issues provide and the other doesn’t want to be seen as “bad” in our odious current degenerate culture.
The continued attempt to use empirical science protocols to further social/political agendas is disappointing. As this critique has pointed out research design and inferential statically analysis is not magic. It is driven by RULES you are supposed to ascribe too (recall your dissertation defenses, please). It’s misuse by agenda driven colleagues who have apparently just chosen apostasy to their ethos is…well painful. Come on folks demonstrable defensible evidence is supposed to be the standard you trained for…not “gotja” points toward the trends of the moment.